Trends in Sale-to-List Price Ratio: A Sign of Virginia’s Tight Housing Market
August 15, 2019
By: Virginia REALTORS® Chief Economist, Lisa Sturtevant, PhD
 The sale-to-list price ratio is one indicator of the “temperature” of a local housing market. “Hot” markets tend to have high and rising sale-to-list ratios, while “cooler”, or more neutral markets, have lower and steadier ratios.
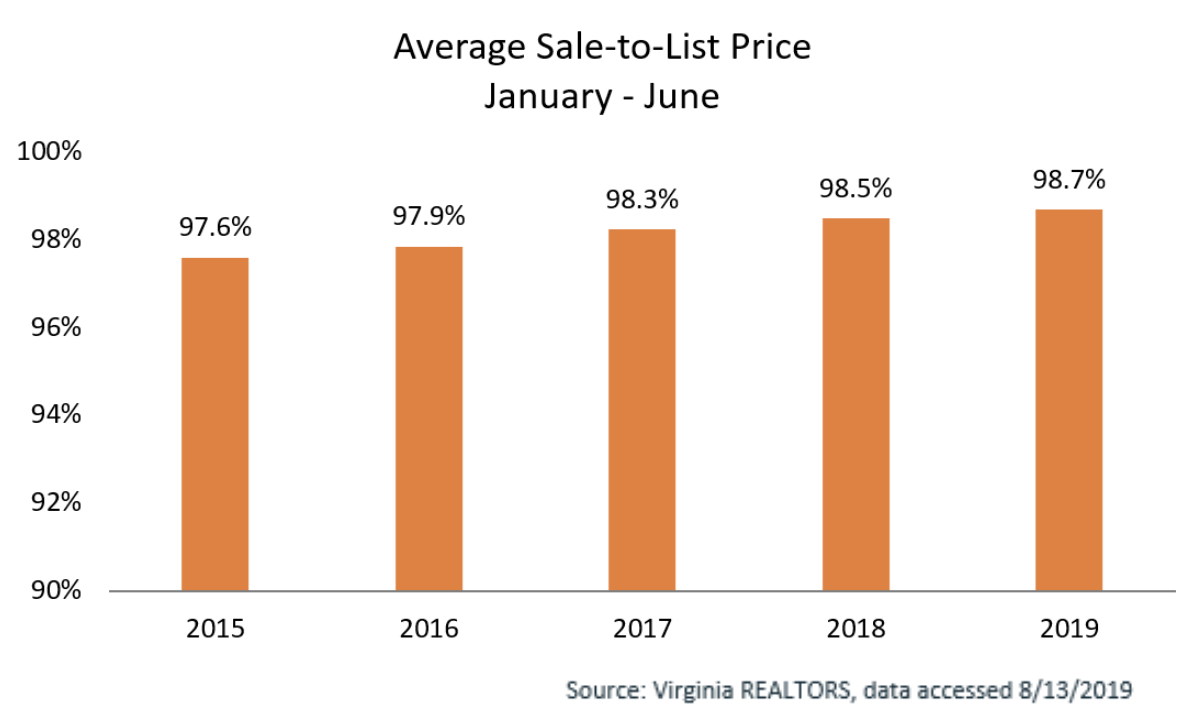
The sale-to-list price ratio is calculated as the final sale price divided by the last list price. If the ratio is above 100%, the home sold for more than the list price. If it is less than 100%, the home sold for less than the list price. Since 2015, the average sale-to-list price ratio in Virginia has been greater than 98%, but it has actually been rising in recent years, and there is a considerable variability across local markets.
In the first 6 months of 2019, the sale-to-list price ratio for all sales in Virginia was 98.7%, meaning that the average sold price was 98.7% of the average final list price. This ratio is up slightly from 2018 and up more than a percentage point since 2015. The highest ratio was among homes that sold for between $400,001 and $500,000 but the ratio was above 99% for most price segments. Setting list prices appropriate (i.e. at levels buyers are willing to pay) tends to mean that homes sell more quickly. And in fact, the average days on market has been trending down over the past four years as the sale-to-list price ratio has increased.
There are four local communities where the sale-to-list price ratio was above 100% for the first 6 months of 2019, meaning that homes were selling, on average, for more than list price. The City of Alexandria, Arlington County, and the City of Falls Church all had sale-to-list price ratios of greater than 100%. The ratio was also above 100% in Caroline County.
On the other end of the spectrum, there are communities where final sale prices remain considerably lower than the final list price. Wise, Russell, Buchanan and Bland counties in southwestern Virginia, along with Highland County, all have sale-to-list price ratios below 90%.
You might also like…
5 Key Takeaways from the NAHREP 2023 State of Hispanic Homeownership Report
By Sejal Naik - April 17, 2024
In March 2024, the National Association of Hispanic Real Estate Professionals (NAHREP) released its 2023 State of Hispanic Homeownership Report. Using data from surveys conducted by various public… Read More
3 Multifamily Market Trends from the First Quarter
By Dominique Fair - April 16, 2024
For the last three years, the multifamily market has seen high demand, double digit rent growth, and increased construction to meet demand. These trends are expected to shift… Read More
Virginia’s Housing Market Sees Largest Influx of New Listings Since 2021
By Robin Spensieri - March 29, 2024
According to the February 2024 Virginia Home Sales Report released by Virginia REALTORS®, pace in Virginia’s housing market picked up last month. There were 6,733 homes sold statewide in February,… Read More